TikZJax使用ログ
TikZJaxはかなり難解な代わりに多機能なグラフを記述することができる数学系ライブラリである。
今回はObsidianにそのプラグインがあったのでそれを使用していく。
GitHub - artisticat1/obsidian-tikzjax: Render LaTeX and TikZ diagrams in your notes
Render LaTeX and TikZ diagrams in your notes. Contribute to artisticat1/obsidian-tikzjax development by creating an account on GitHub.

こんな感じ
‘‘‘tikz
\usepackage{circuitikz}
\begin{document}

\begin{circuitikz}[american, voltage shift=0.5]
\draw (0,0)
to[isource, l=$I_0$, v=$V_0$] (0,3)
to[short, -*, i=$I_0$] (2,3)
to[R=$R_1$, i>_=$i_1$] (2,0) -- (0,0);
\draw (2,3) -- (4,3)
to[R=$R_2$, i>_=$i_2$]
(4,0) to[short, -*] (2,0);
\end{circuitikz}

\end{document}
‘‘‘
このコードで
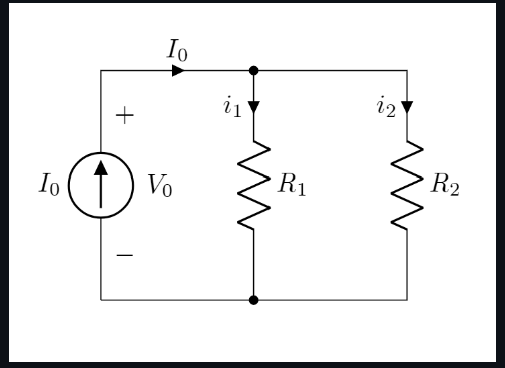
の図が描けるようになる。
なんかむずいな
\begin{document}
  \begin{tikzpicture}[domain=0:4]
    \draw[very thin,color=gray] (-0.1,-1.1) grid (3.9,3.9);
    \draw[->] (-0.2,0) -- (4.2,0) node[right] {$x$};
    \draw[->] (0,-1.2) -- (0,4.2) node[above] {$f(x)$};
    \draw[color=red]    plot (\x,\x)             node[right] {$f(x) =x$};
    \draw[color=blue]   plot (\x,{sin(\x r)})    node[right] {$f(x) = \sin x$};
    \draw[color=orange] plot (\x,{0.05*exp(\x)}) node[right] {$f(x) = \frac{1}{20} \mathrm e^x$};
  \end{tikzpicture}
\end{document}
これはやっぱり使わなくていいかも
でも使いこなせたらめっちゃいいかもしれないけど
学習コストがすごい
\usepackage{circuitikz}
\begin{document}

\begin{circuitikz}[american, voltage shift=0.5]
\draw (0,0)
to[isource, l=$I_0$, v=$V_0$] (0,3)
to[short, -*, i=$I_0$] (2,3)
to[R=$R_1$, i>_=$i_1$] (2,0) -- (0,0);
\draw (2,3) -- (4,3)
to[R=$R_2$, i>_=$i_2$]
(4,0) to[short, -*] (2,0);
\end{circuitikz}

\end{document}